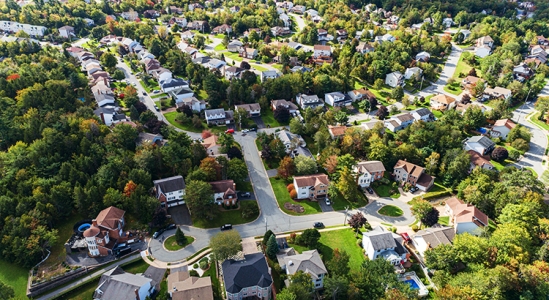
The latest statistics about our San Antonio real estate market.
What has been happening in our market? Today I’ll cover all the recent stats and fill you in on the challenges we’re seeing, the general atmosphere of the market, and more.
In a previous blog post, I predicted our market would have between 2.5 and 2.7 months of inventory by now, and I was right on target. We are at 2.6 months of inventory, which is up from 1.2, the number from. This is still a seller’s market, but homes are taking a little longer to sell.
The average days on market is around 27, but that can go up to 40 days in certain price ranges. There are also niche markets where homes are still selling over the weekend and getting multiple offers.
“This is still very much a seller’s market.”
Our market currently has 5,114 new listings and 9,068 active homes. Pending sales are still strong at 3,249. Prices have increased by 35% since last year, with the average price per square foot up to $186. On top of that, this price seems to be pretty stable.
Let’s break down the price ranges. Around 8.5% of homes are below $200,000. This will likely keep shrinking as the cost of goods keeps rising. San Antonio just isn’t that affordable of a market anymore. The $200,000 to $500,000 range now has 71.9% of the available homes, which has stayed steady. Homes above $500,000 represent 19.5% of the market, and this price range is poised to grow.
The average rent price is $1,908, but I have also seen rental prices balance. Rental properties are staying on the market a bit longer, just like resale properties. However, if you haven’t increased your rent in the last few years, you need to get a valuation because you can probably raise your rent.
If you have any questions about this update or our market in general, feel free to call or email me. I’d love to hear from you.


